The size and composition of agencies that submitted data for the FY 2025 assessment provides context for interpreting governmentwide accessibility outcomes. Agencies self-reported their size based on estimated federal employee counts at the time of data submission; for this analysis, GSA reclassified one cabinet-level agency as a “very large agency” using January 2026 FedScope data. No other agency classifications were changed.
Sixty agencies submitted data, comprising:
The FY 2025 assessment asked agencies to respond to criteria that fell into four accessibility factors, grouped into two evaluation indices:
The assessment details each of these accessibility factors in later sections of the report and in Appendix A: Methods.
Findings
GSA evaluated responses to specific assessment criteria to generate an aggregated rating or outcome on a 5-point scale and determine how well an agency fared for each accessibility factor. GSA grouped outcomes into performance categories that ranged from Very Low to Very High, similar to previous years of this report. Table 1 below denotes the outcome scale ranges and corresponding performance categories.
| Outcome Range | Performance Category |
|---|---|
| 0 to 1 | Very Low |
| >1 to 2 | Low |
| >2 to 3 | Moderate |
| >3 to 4 | High |
| >4 to 5 | Very High |
| Factor | Average Outcome | Performance Category | Evaluation Indices |
|---|---|---|---|
| Policy Integration | 3.04 | High | Implementation (i-index) |
| ICT Acquisition and Procurement | 3.44 | High | Implementation (i-index) |
| Testing and Remediation | 2.00 | Low | Implementation (i-index) |
| Accessibility Conformance | 1.96 | Low | Conformance (c-index) |
Implementation-Conformance Relationship - Scatterplot Analysis
GSA combined the outcomes for three accessibility factors—Policy Integration, Acquisition and Procurement, and Testing and Remediation—into one summary evaluation index: the Accessibility Implementation (i-index). We use this summary index to compare the administration, policy integration and execution of ICT accessibility across the enterprise with the agencies’ overall Accessibility Conformance (c-index). Figure 1 shows the outcomes for each of these indices by agency:
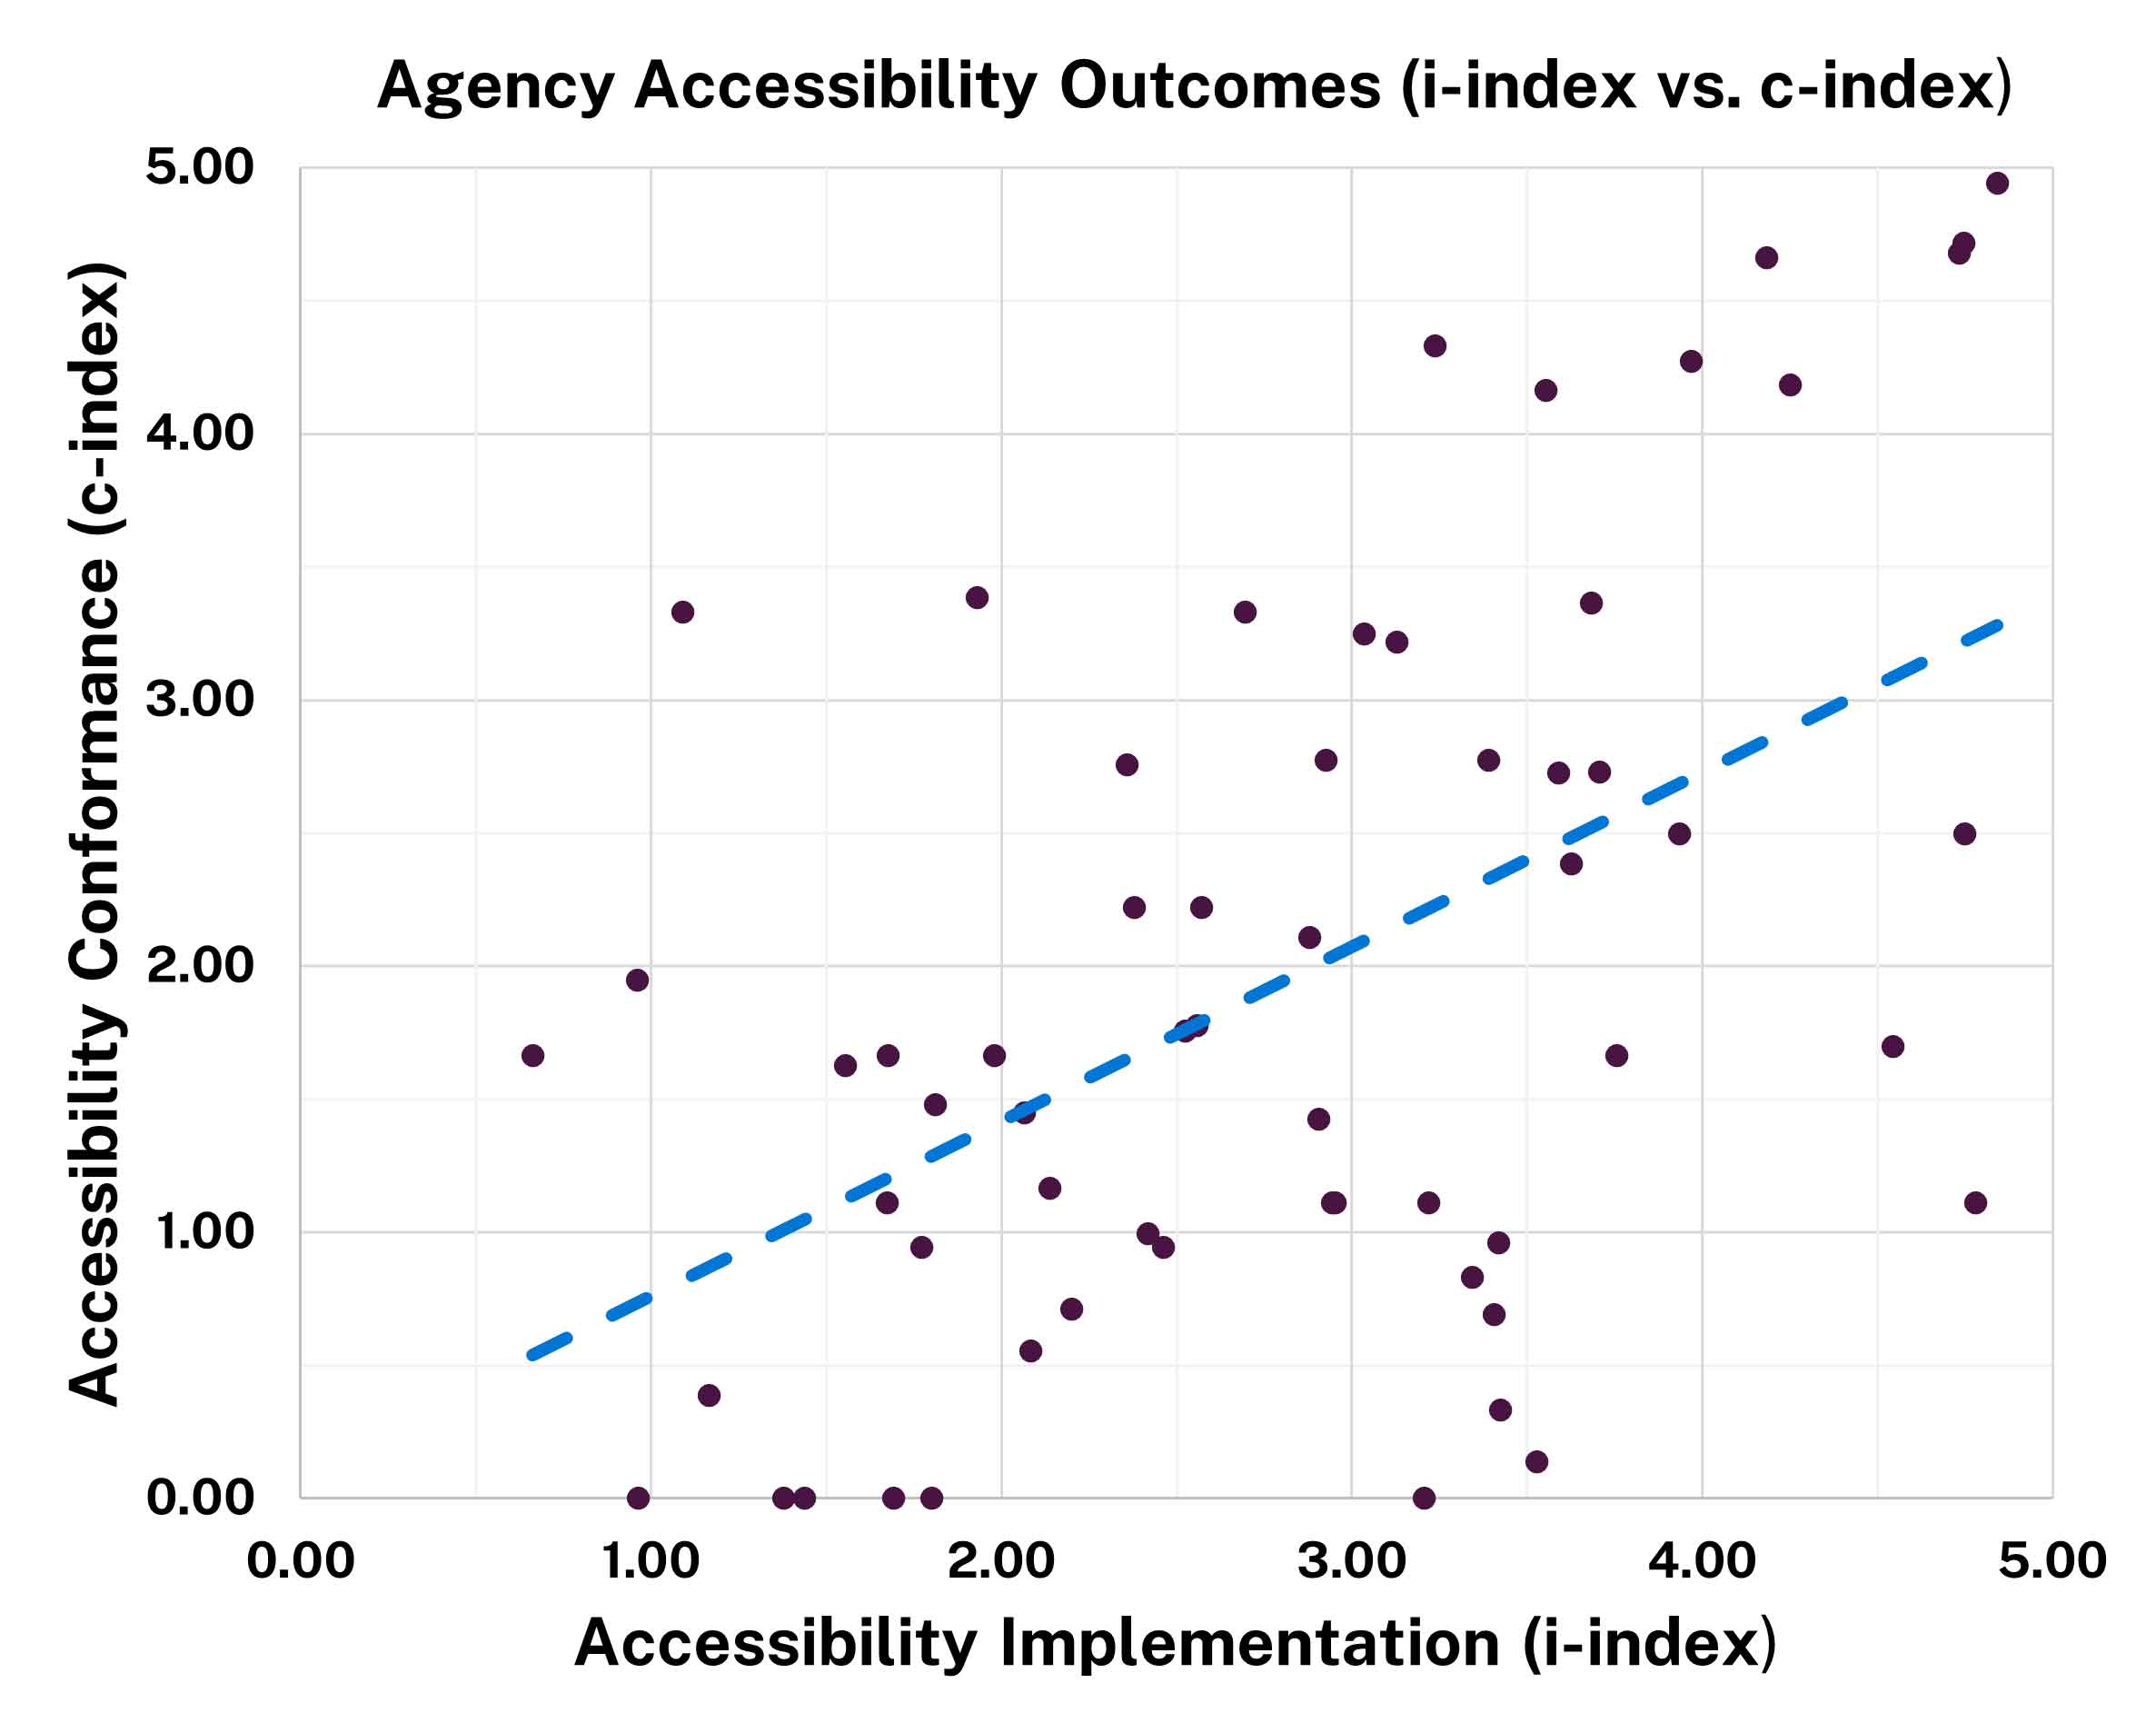
Figure 1 shows a wide range of outcomes for both Accessibility Implementation and Accessibility Conformance. Implementation outcomes ranged from 0.66 to 4.84, while conformance ranged from 0 to 4.94. The graph shows a positive relationship between implementation and conformance, as demonstrated by the dashed line. Agencies that invest and implement repeatable accessibility processes across the enterprise are more likely to have positive outcomes with respect to accessibility conformance. In general, the better an agency integrates accessibility best practices across the enterprise, the better conformance outcomes they tend to have. The presence of a notable group of agencies where higher implementation levels do not correspond with higher conformance outcomes suggests potential challenges related to the quality of accessibility practices or gaps between implementation activities and measurable results. Some agencies achieve moderate conformance despite limited enterprise integration, suggesting localized or ad hoc success that may not scale or sustain without stronger governance.
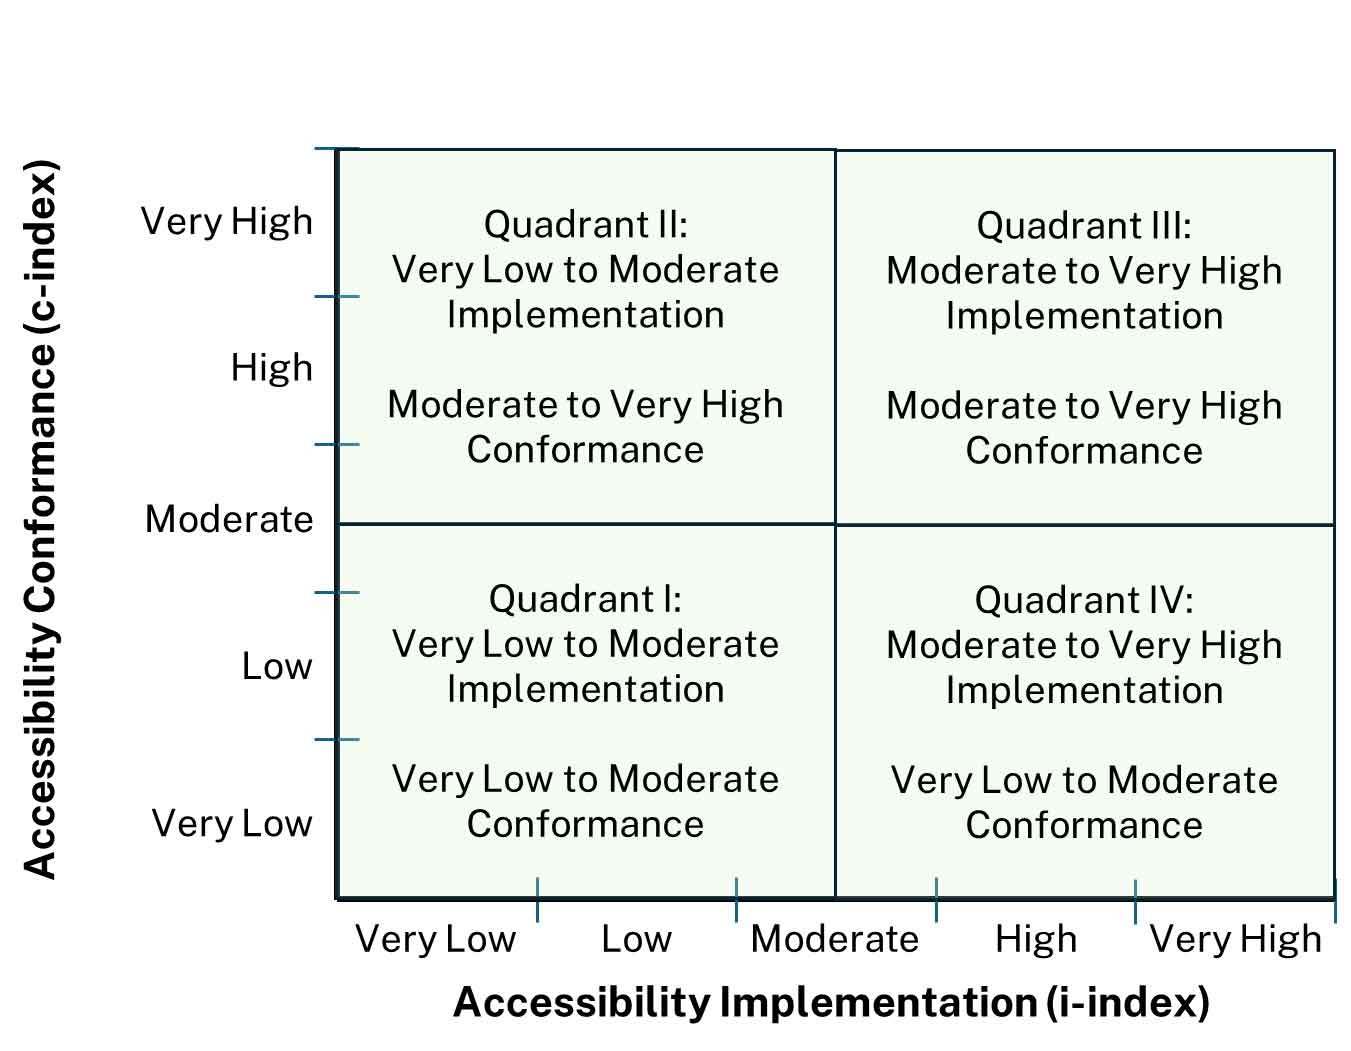
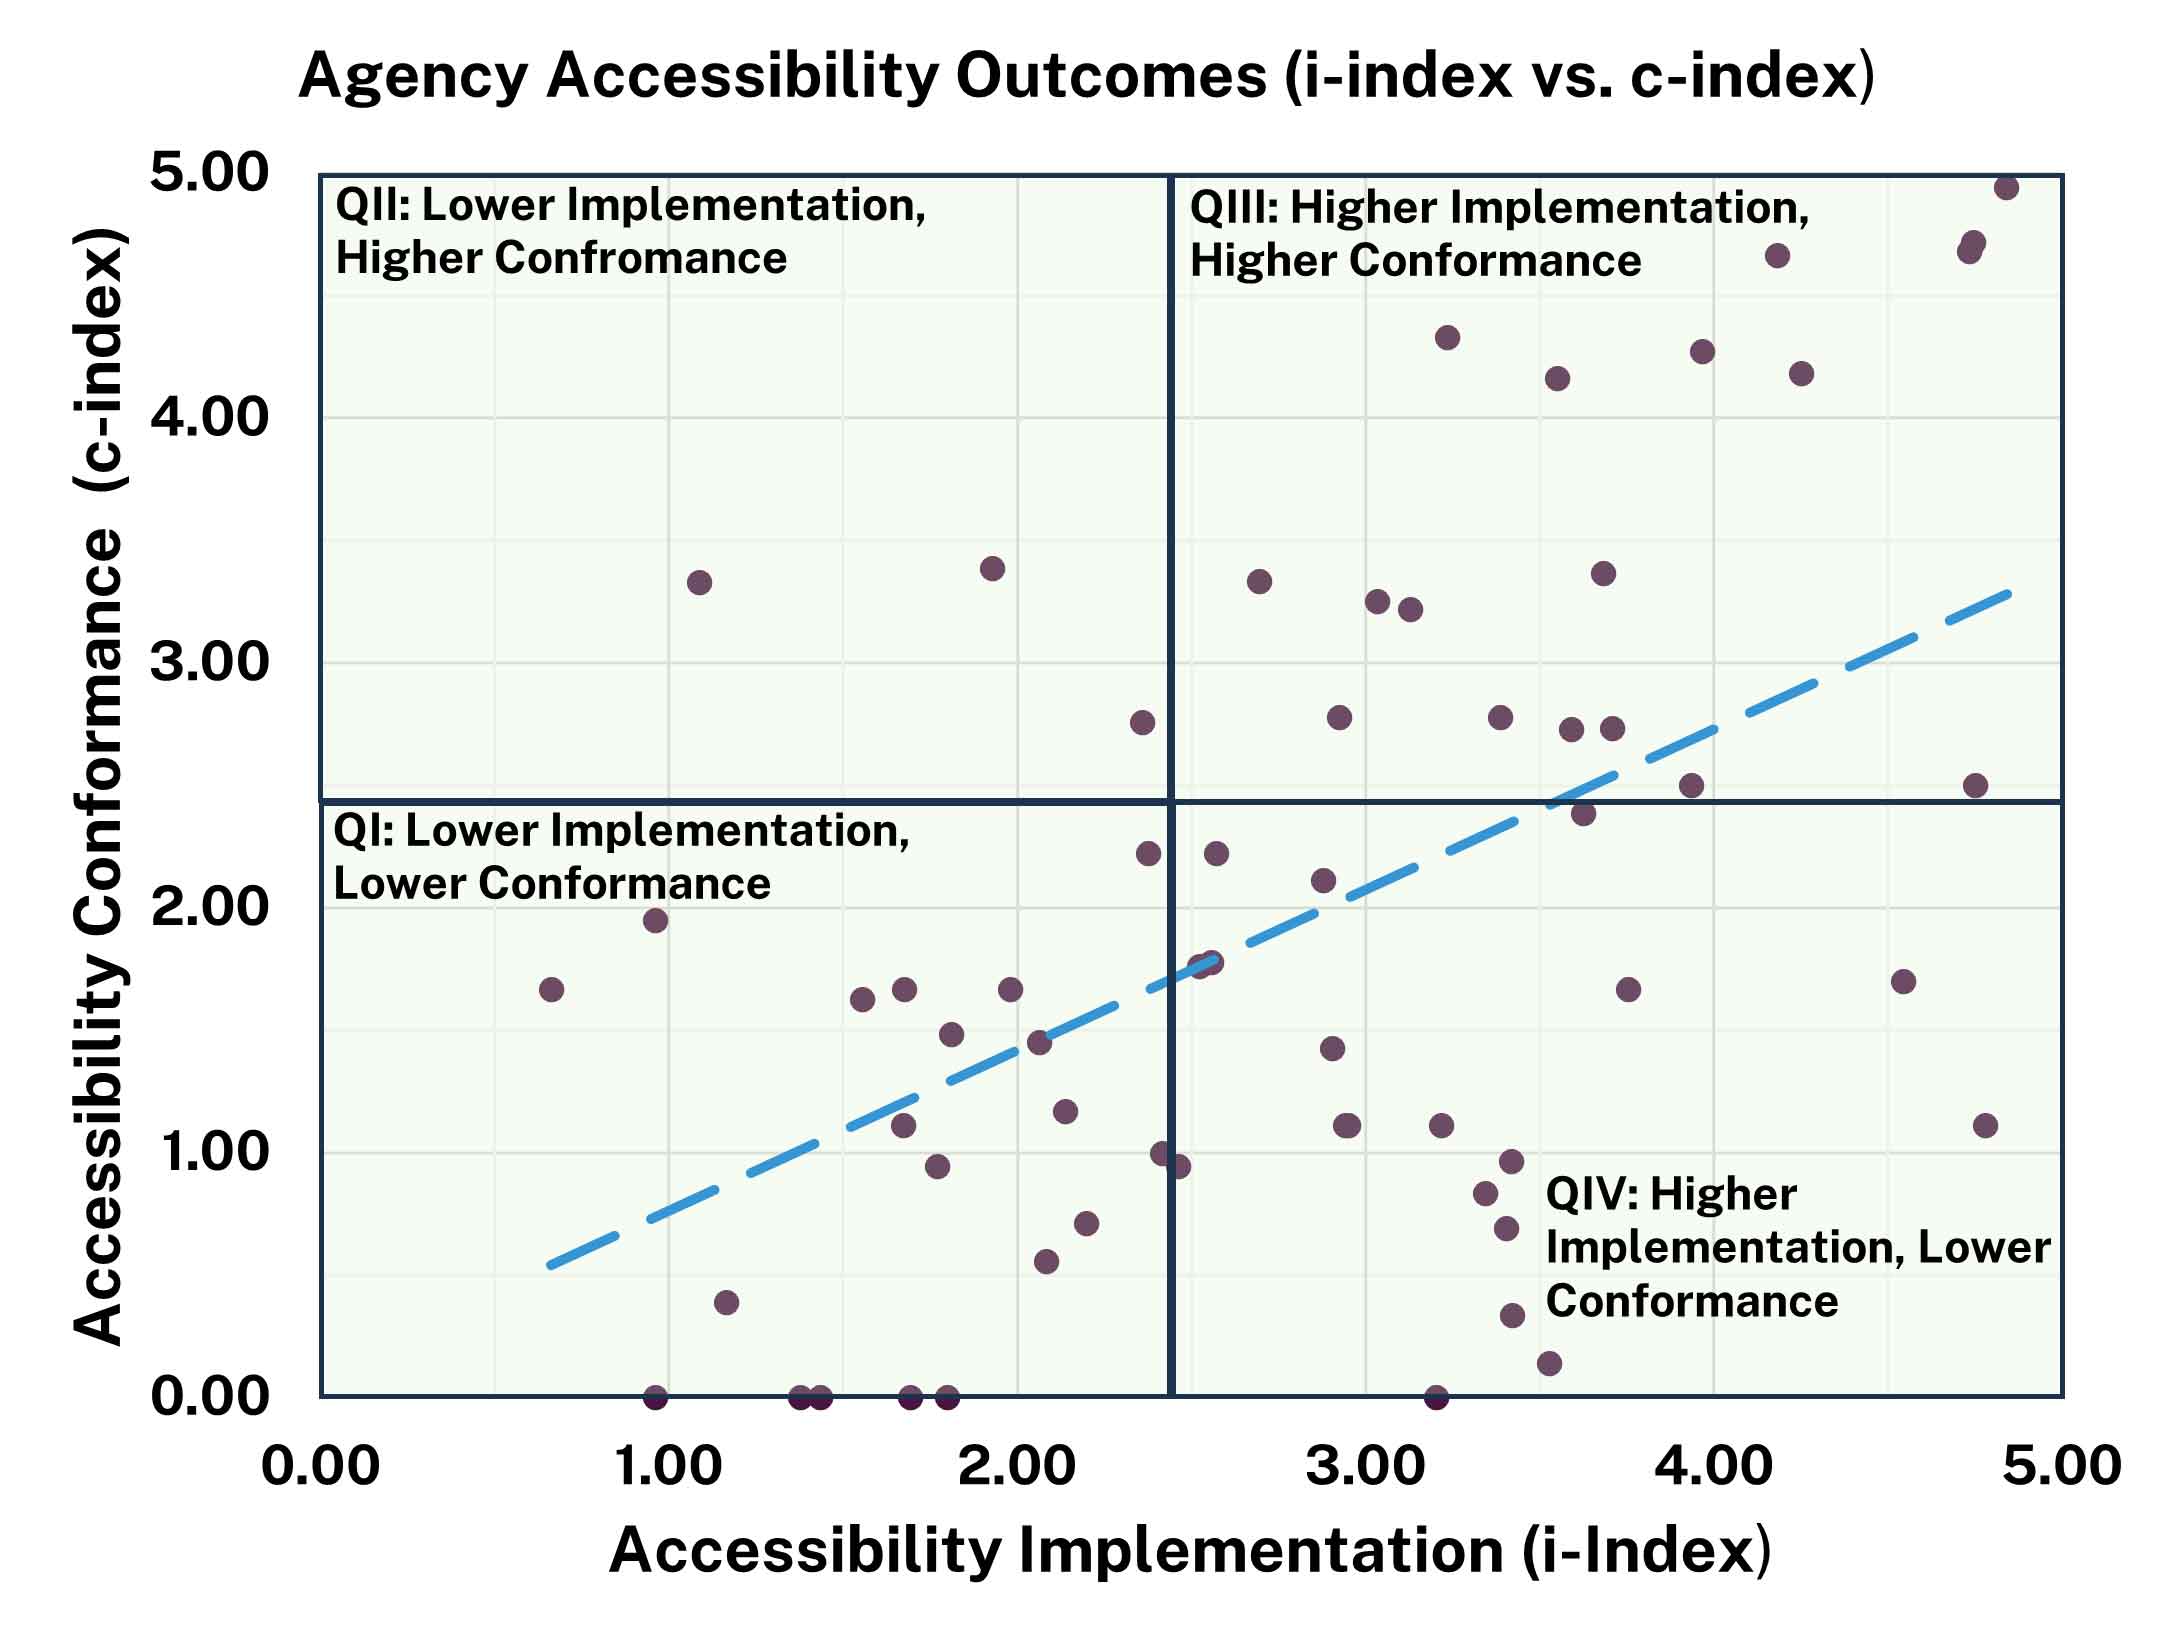
For more discrete analysis, we grouped agency accessibility outcomes into four quadrants as shown in Figure 2 with the boundaries ranging from 0 to 2.5 and >2.5 to 5.
| Quadrant | # of Agencies | Quadrant Recommendation |
|---|---|---|
| III: Higher Implementation, Higher Conformance | 16 | Continue investment and a focus on continuous process improvement activities to see incremental improvements in both inputs (integration, acquisitions, testing) and outputs (ICT conformance). |
| IV: Higher Implementation, Lower Conformance | 20 | Prioritize investment in the execution of testing processes and ways to implement established policy and standard operating procedures to increase conformance. |
| II: Lower Implementation, Higher Conformance, | 3 | Prioritize investment in the developing processes and developing policies that champion and institute ICT accessibility across the enterprise. |
| I: Lower Implementation, Lower Conformance | 21 | Focus on establishing baseline governance by assigning ownership, adopting core policies and procedures, and prioritizing testing and remediation for high-impact ICT, leveraging shared services and existing federal resources. |
Reviewed/Updated: March 2026