Skip to secondary navigation Skip to main content

Findings: Conformance of Top Viewed ICT

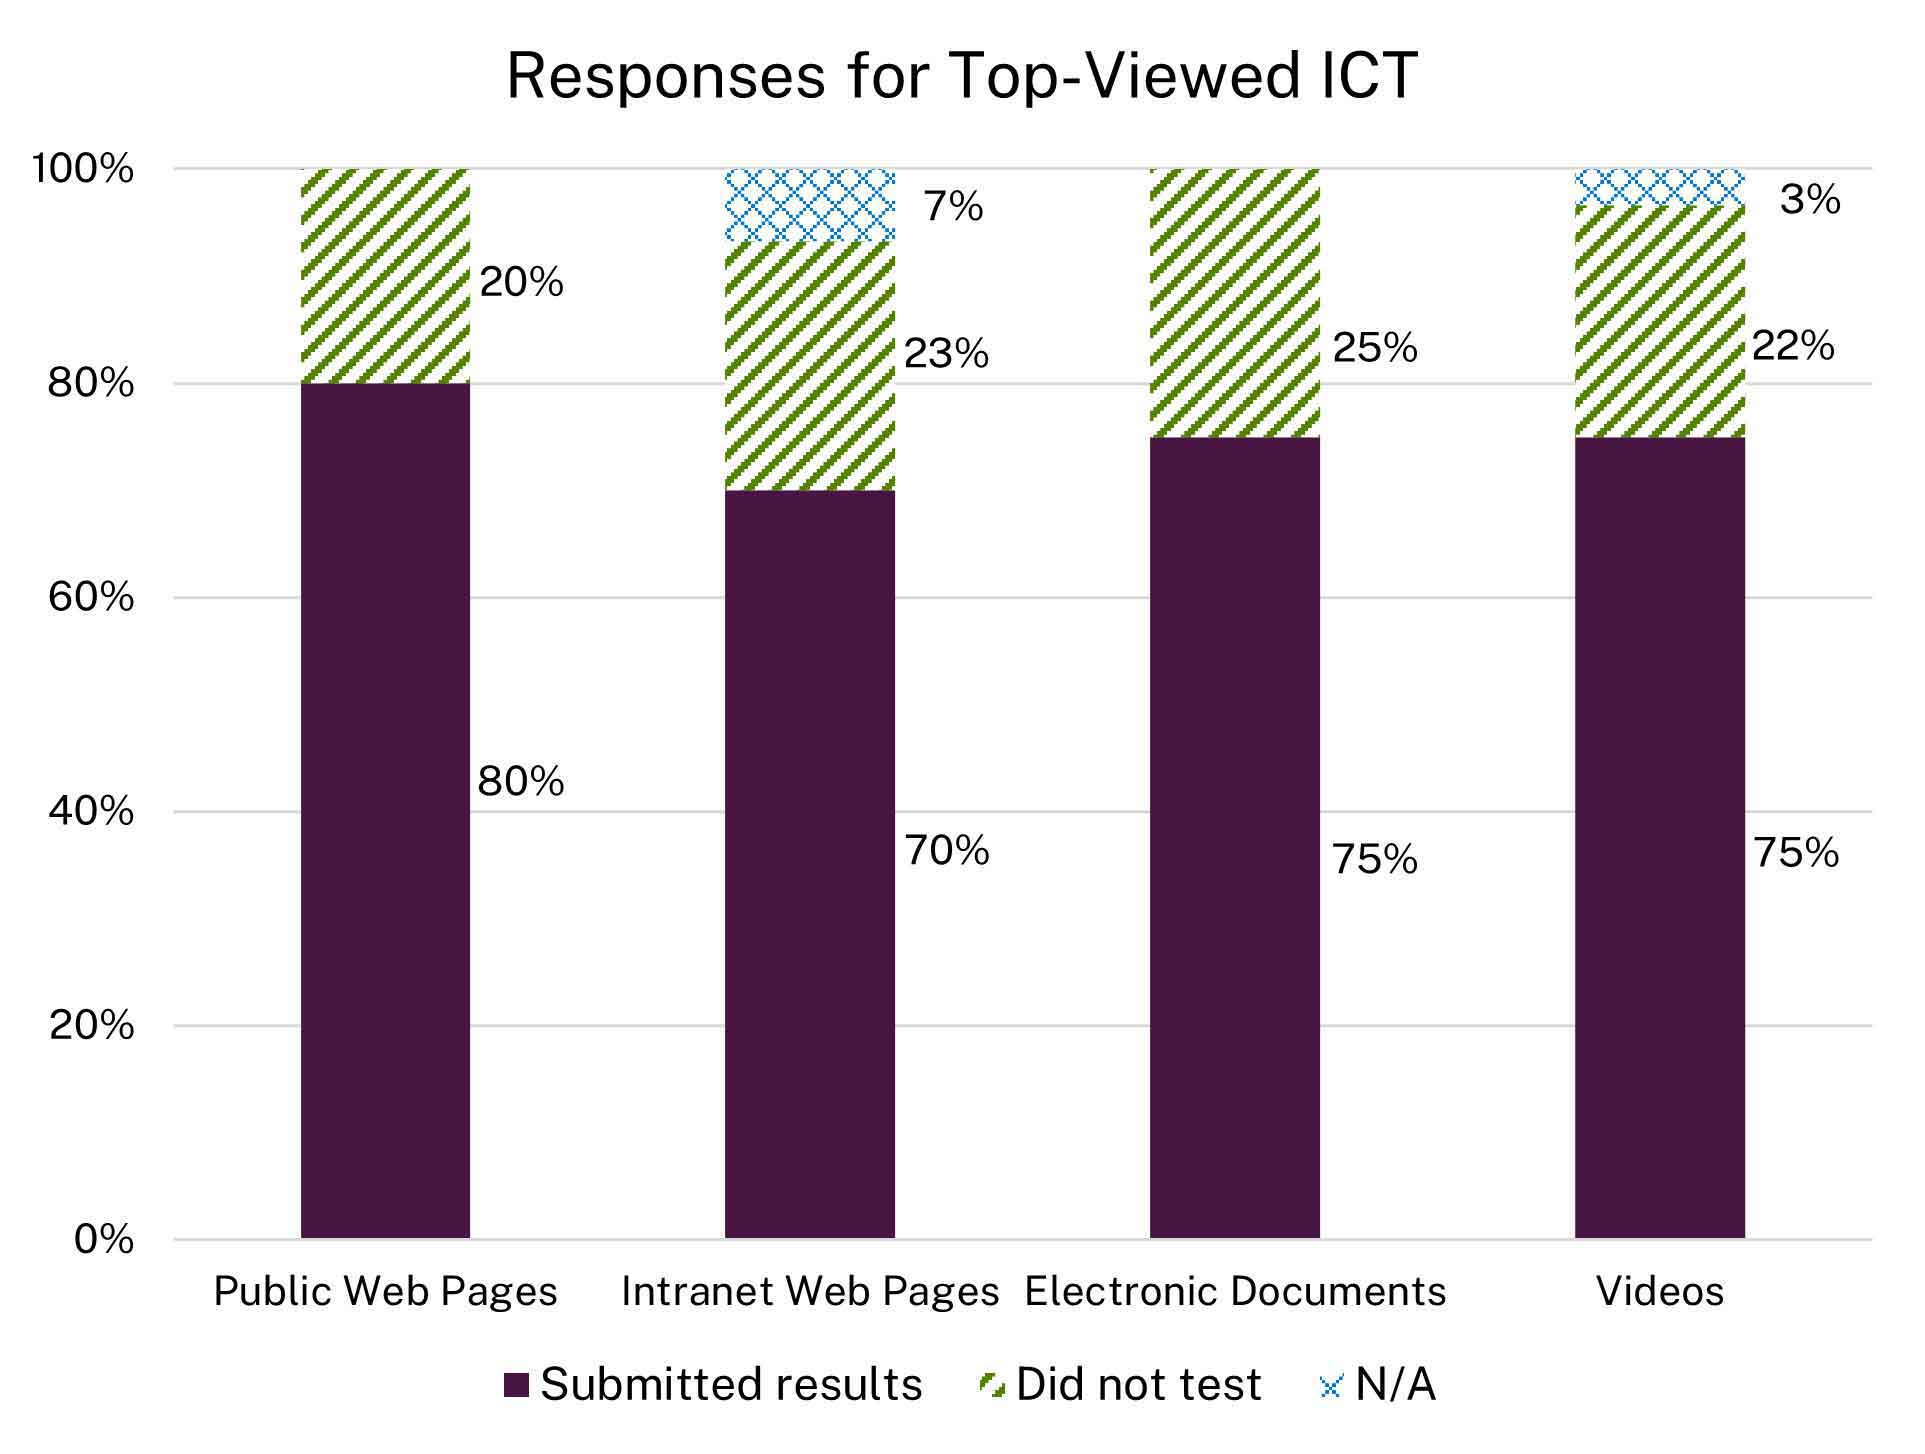
As Figure 4 shows, on average, 23 percent of agencies did not test at least one of their top-viewed ICTs. This year’s submission included less top-viewed ICT data because components did not submit their own data; instead, it was included in their parent agencies’ submissions. The top-viewed submissions only included the top five videos and top 10 web pages and electronic documents for the entire agency or parent agency. The submitted data indicates that agencies lack sufficient resources or capacity to conduct comprehensive testing of the ICT they procure, develop, maintain, or use.

Stacked bar chart showing responses for top-viewed ICT:
80% of agencies submitted results for public web pages and 20% did not test. 70% of agencies submitted results for intranet web pages while 23% did not test and 7% did not have intranet. 75% of agencies submitted results for electronic documents while 25% did not test. 75% of agencies submitted results for videos while 22% did not test and 3% did not have any videos.
Figure 4. Percentage of responses for top-viewed ICT

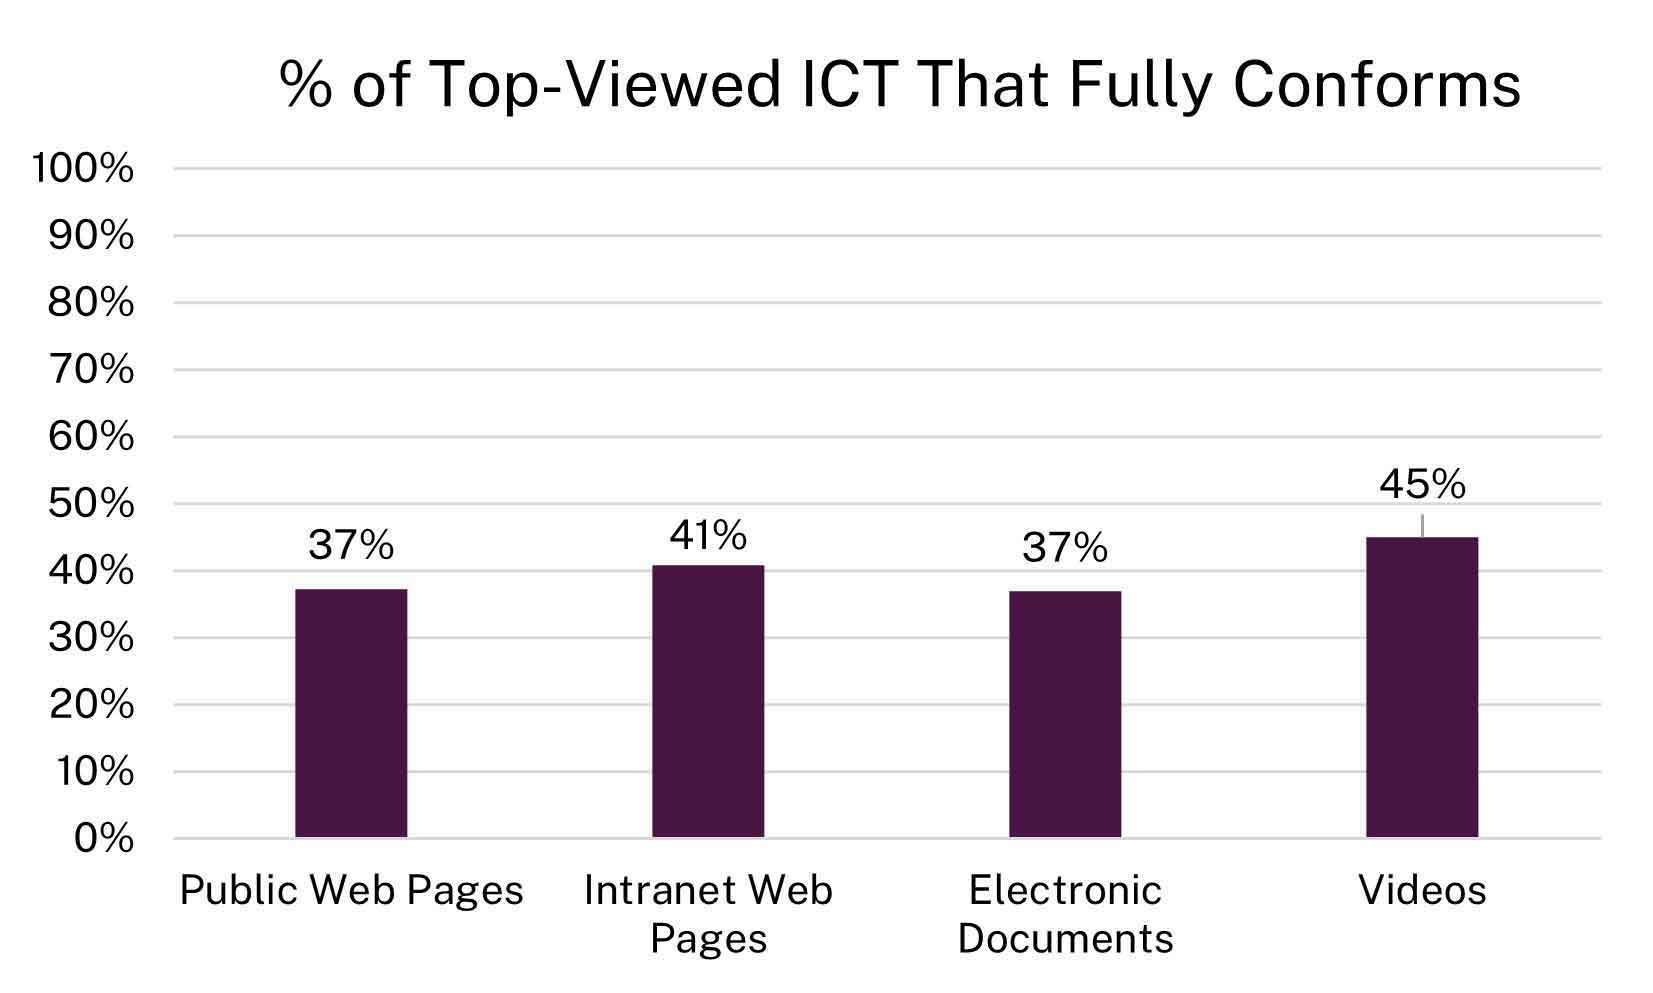
The governmentwide Section 508 conformance overall for the top-viewed ICT is low, with less than half fully conformant to Section 508 standards. The reported top-viewed ICT outcomes shows:

  • Public Web Pages

    37% | Fully Conformant
  • Intranet Web Pages:

    41% | Fully Conformant
  • Public Electronic Documents

    37% | Fully Conformant
  • Public Videos

    45% | Fully Conformant
Reported conformance rates for top-viewed ICT are higher than in prior years; however, these results may reflect changes in reporting rather than a direct measure of improvement. Compared to FY 2024, fewer agencies reported that they lacked the resources to test ICT, resulting in fewer zero-value responses, and the overall number of respondents declined. Together, these factors affect the distribution of results. As such, readers should avoid comparing year-over-year conformance percentages.
Bar chart of percent of top-viewed ICT that fully conforms showing 37% of public web pages fully conform; 41% of intranet web pages fully conform; 37% of electronic documents fully conform; and 45% of videos fully conform.
Figure 5. Percentage of top-viewed ICT that fully conforms
Table 6: Top viewed ICT key data points
Top-Viewed ICT by Type Number of agencies that tested ICT (out of 60) Number of agencies that did not test ICT (out of 60 agencies) Percentage of fully conformant ICT governmentwide
Public Web Pages 48 12 37%
Intranet Web Pages 42
Four agencies noted they do not have an intranet.
14 41%
Public Electronic Documents 45 15 37%
Public Videos 45
Two agencies noted they do not have any videos.
13 45%

Top Defects

  • Top Section 508 Defect in Most Viewed Videos:

    • 36 CFR 1194 53.42 Audio Description Controls
  • Five Most Common Defects for Top Viewed Public and Intranet Web Pages:

    • 1.1.1 Non-text Content
    • 1.3.1 Info and Relationships
    • 1.4.3 Contrast (Minimum)
    • 2.4.4 Link Purpose (in Context)
    • 4.1.2 Name, Role, Value
  • Five Most Common Defects for Top Viewed Public Electronic Documents:

    • 1.1.1 Non-text Content
    • 1.3.1 Info and Relationships
    • 1.3.2 Meaningful Sequence
    • 2.4.2 Page Titled
    • 2.4.6 Headings and Labels

Reviewed/Updated: March 2026

Section508.gov

An official website of the General Services Administration

Looking for U.S. government information and services?
Visit USA.gov