Dimensional Highlights
Maturity questions ranged from Q22 to Q61 (excepting Q27B) (See FY-2023-Data-Dictionary-(XLSX)). These questions are grouped into the following nine maturity dimensions: IT Accessibility Program Office; Policies, Procedures, and Standards; Communications; Content Creation; Human Capital, Culture, and Leadership; Technology Lifecycle Activities, Testing and Validation; Acquisition and Procurement; and Training. Below are the overall outcomes for governmentwide maturity:
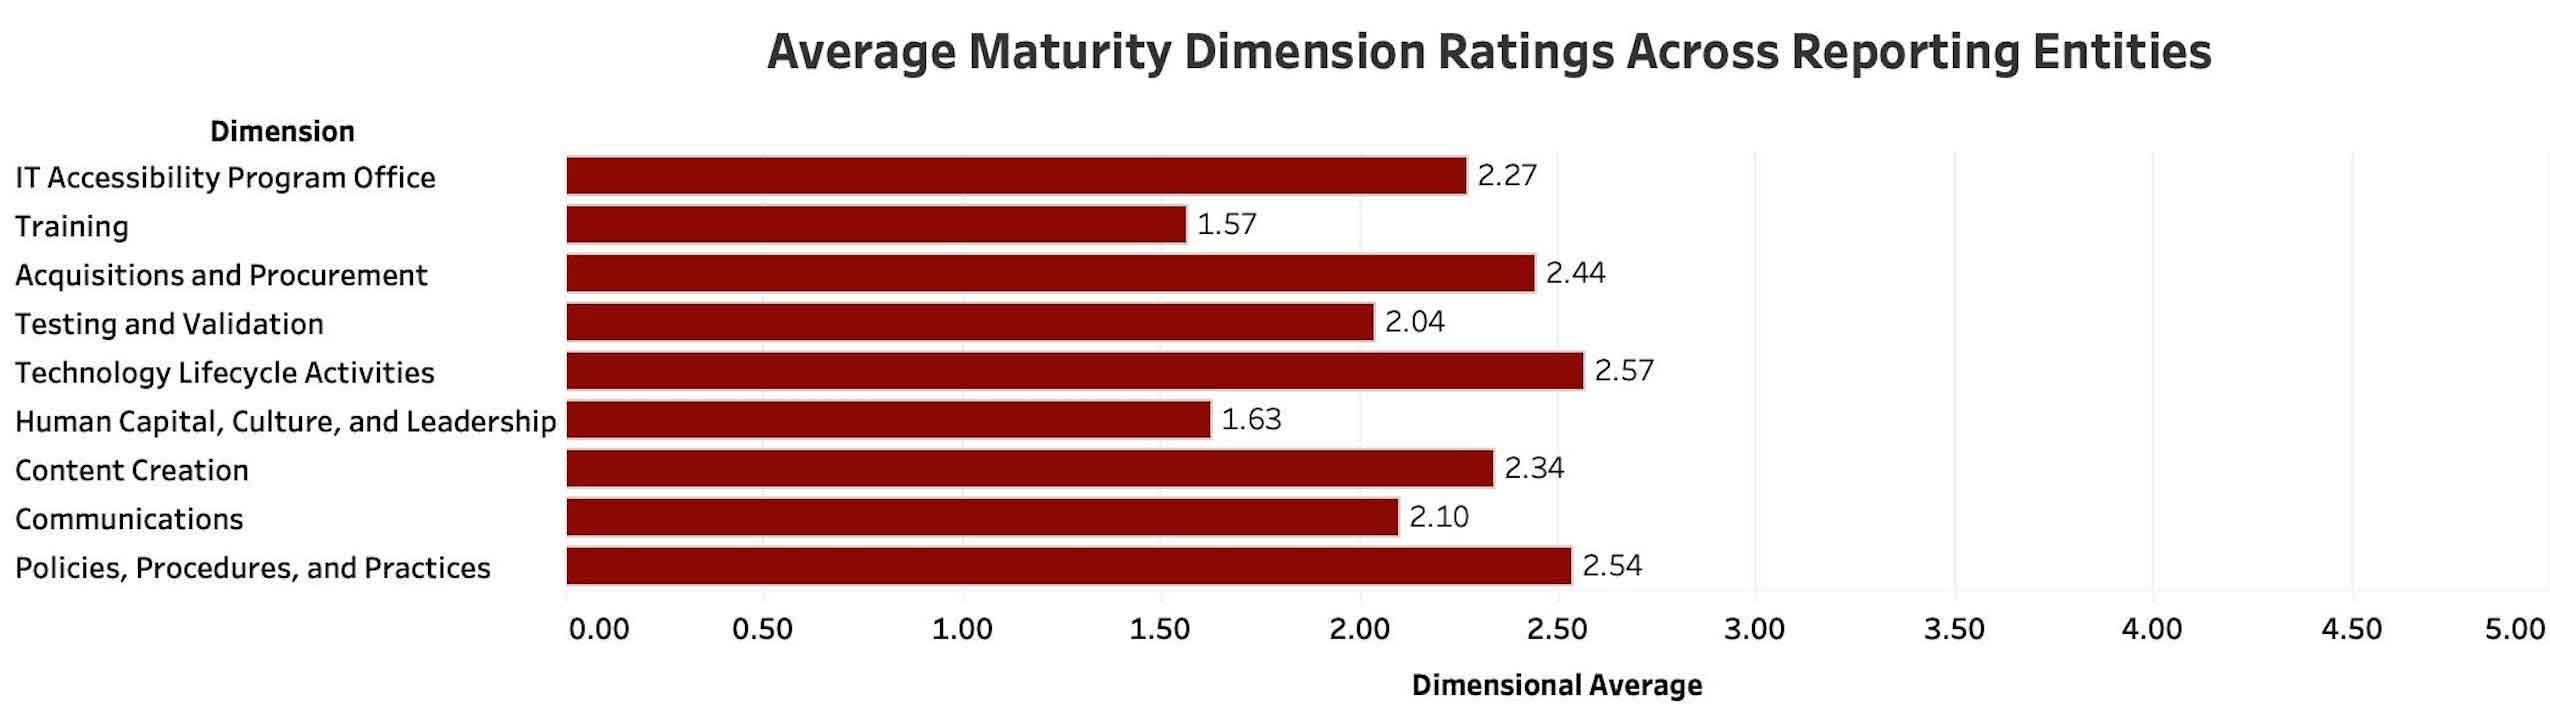
- Highest Maturity Dimension Across Government: Technology Lifecycle Activities (Average of 2.57 out of 5). See Figure 5 below summarizing all averages.
- Second Highest Maturity Dimension: Policies, Procedures, and Standards (Average of 2.54 out of 5)
- Lowest Maturity Dimension: Training (Average of 1.57 out of 5)
- Second Lowest Maturity Dimension: Human Capital, Culture, and Leadership (Average of 1.63 out of 5)
Additional Statistics and Summary Chart
Some additional descriptive statistics around the maturity dimensions include:
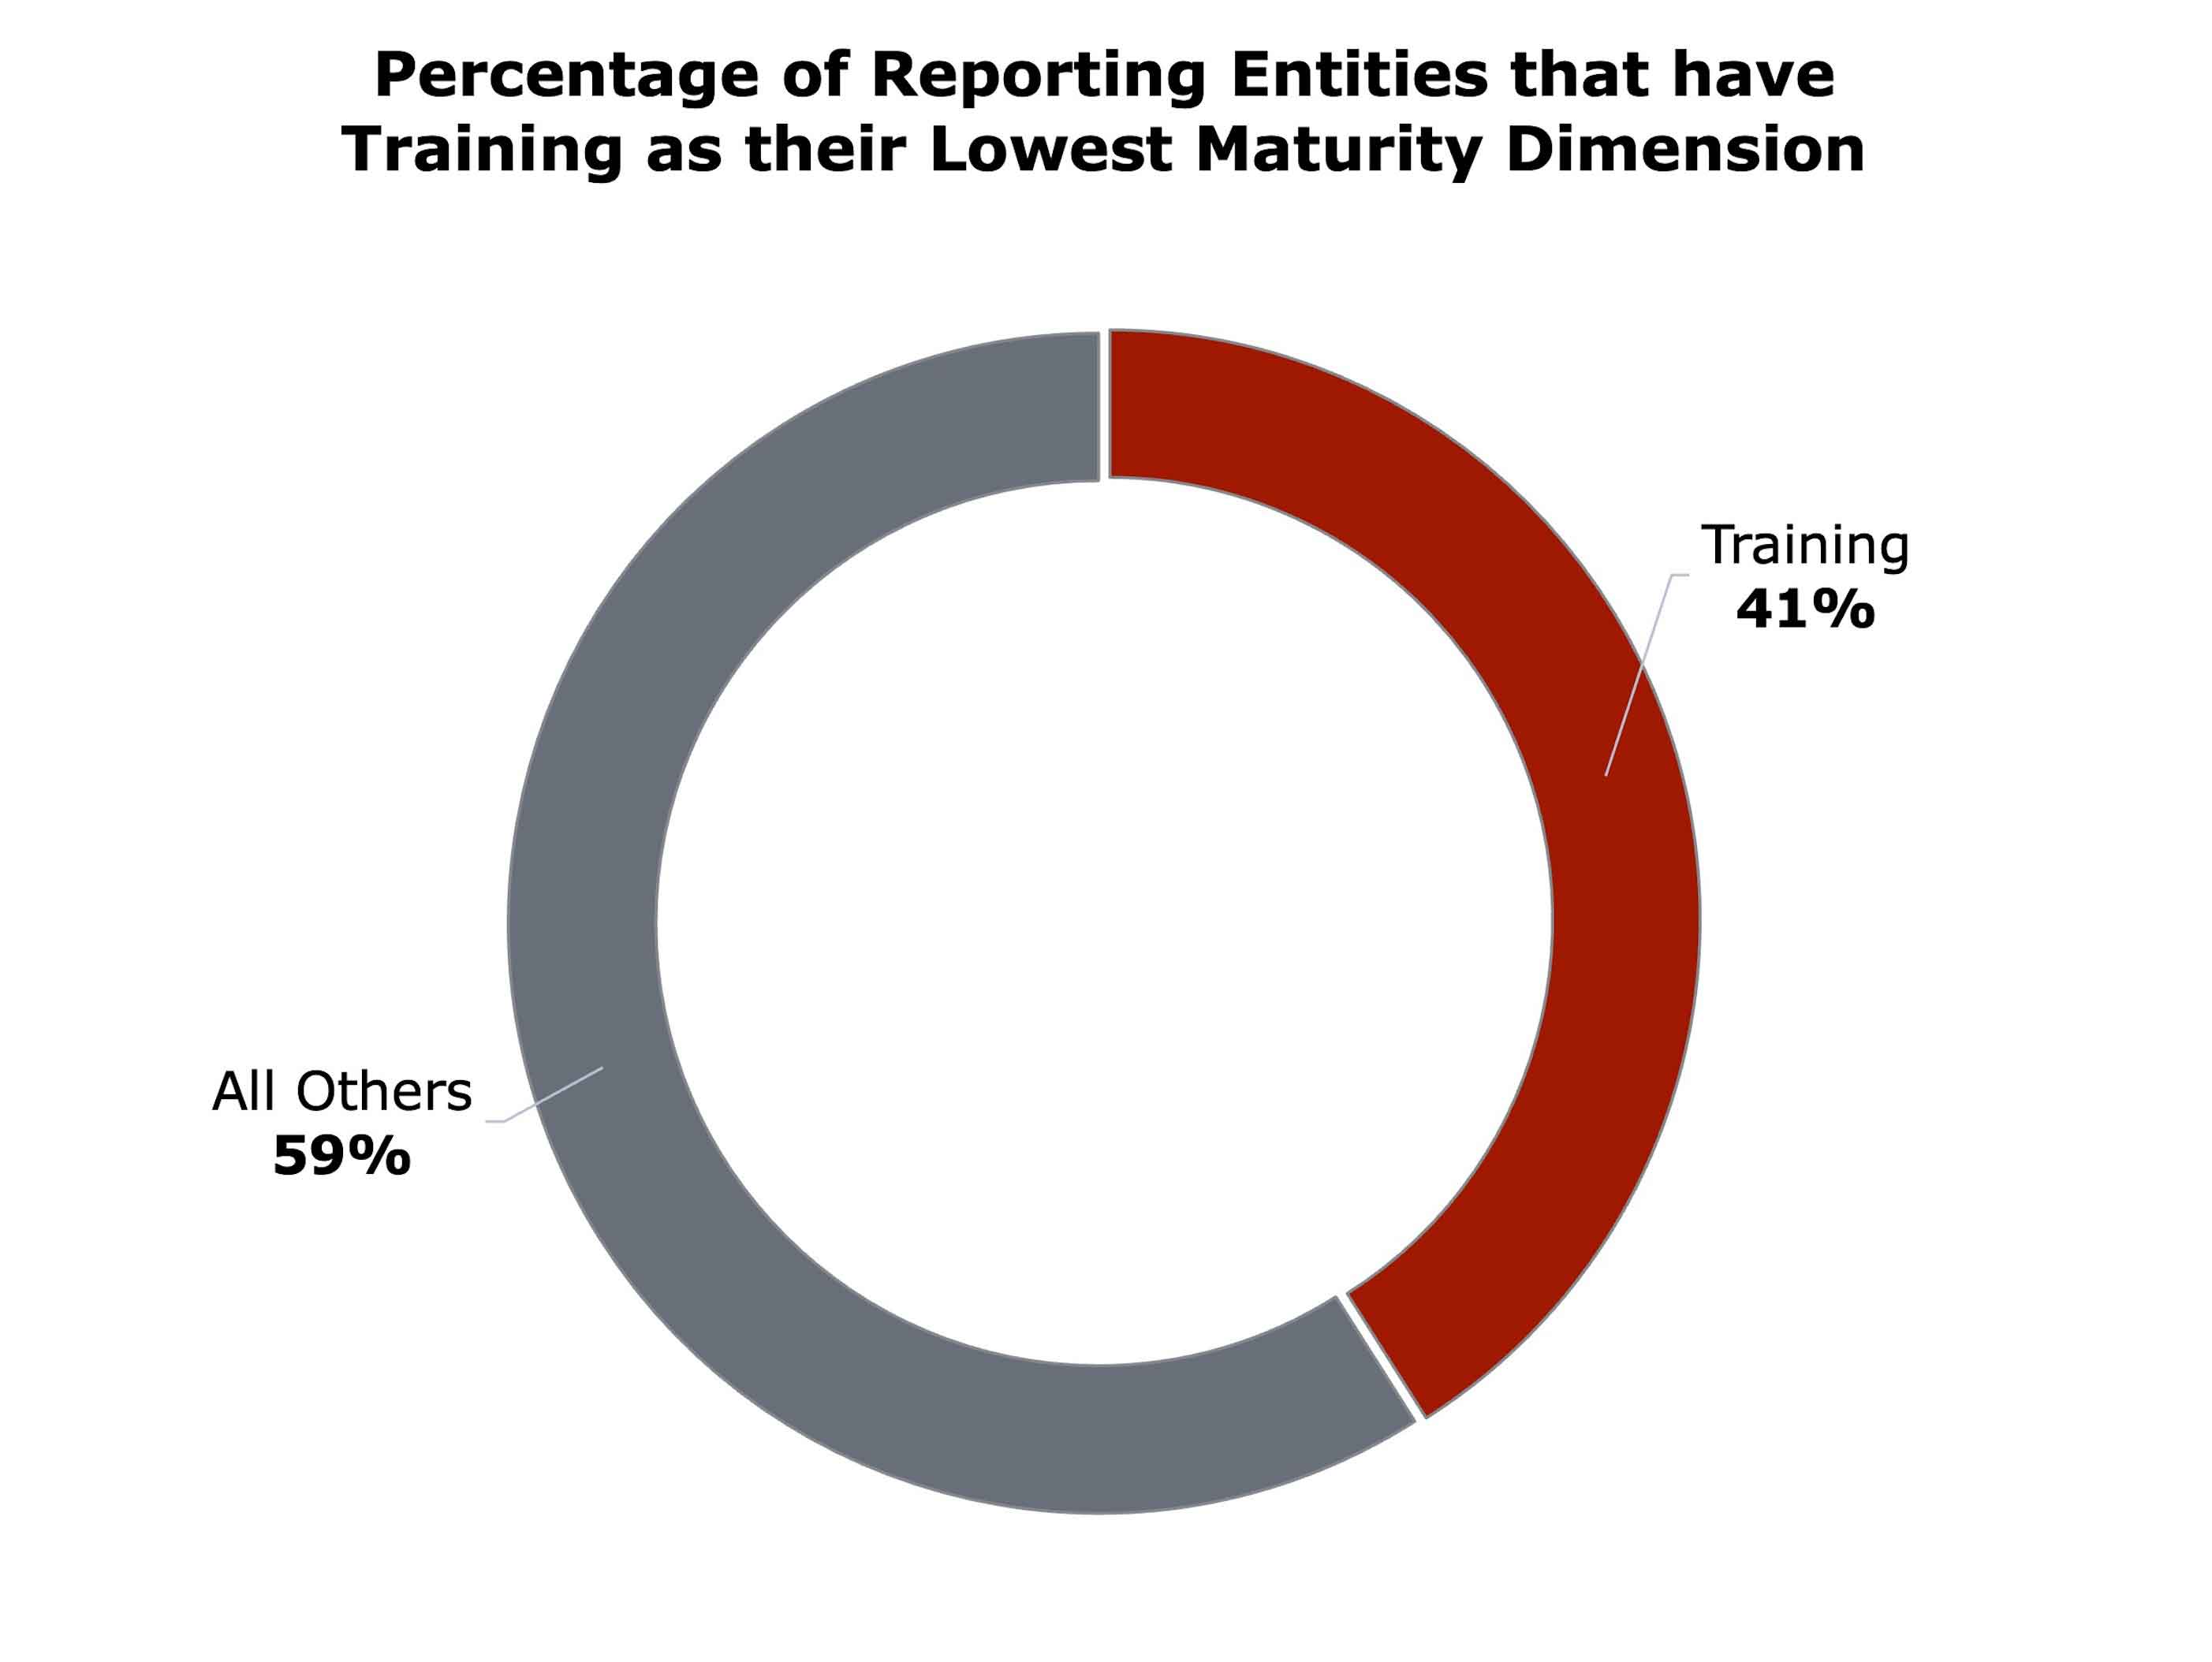
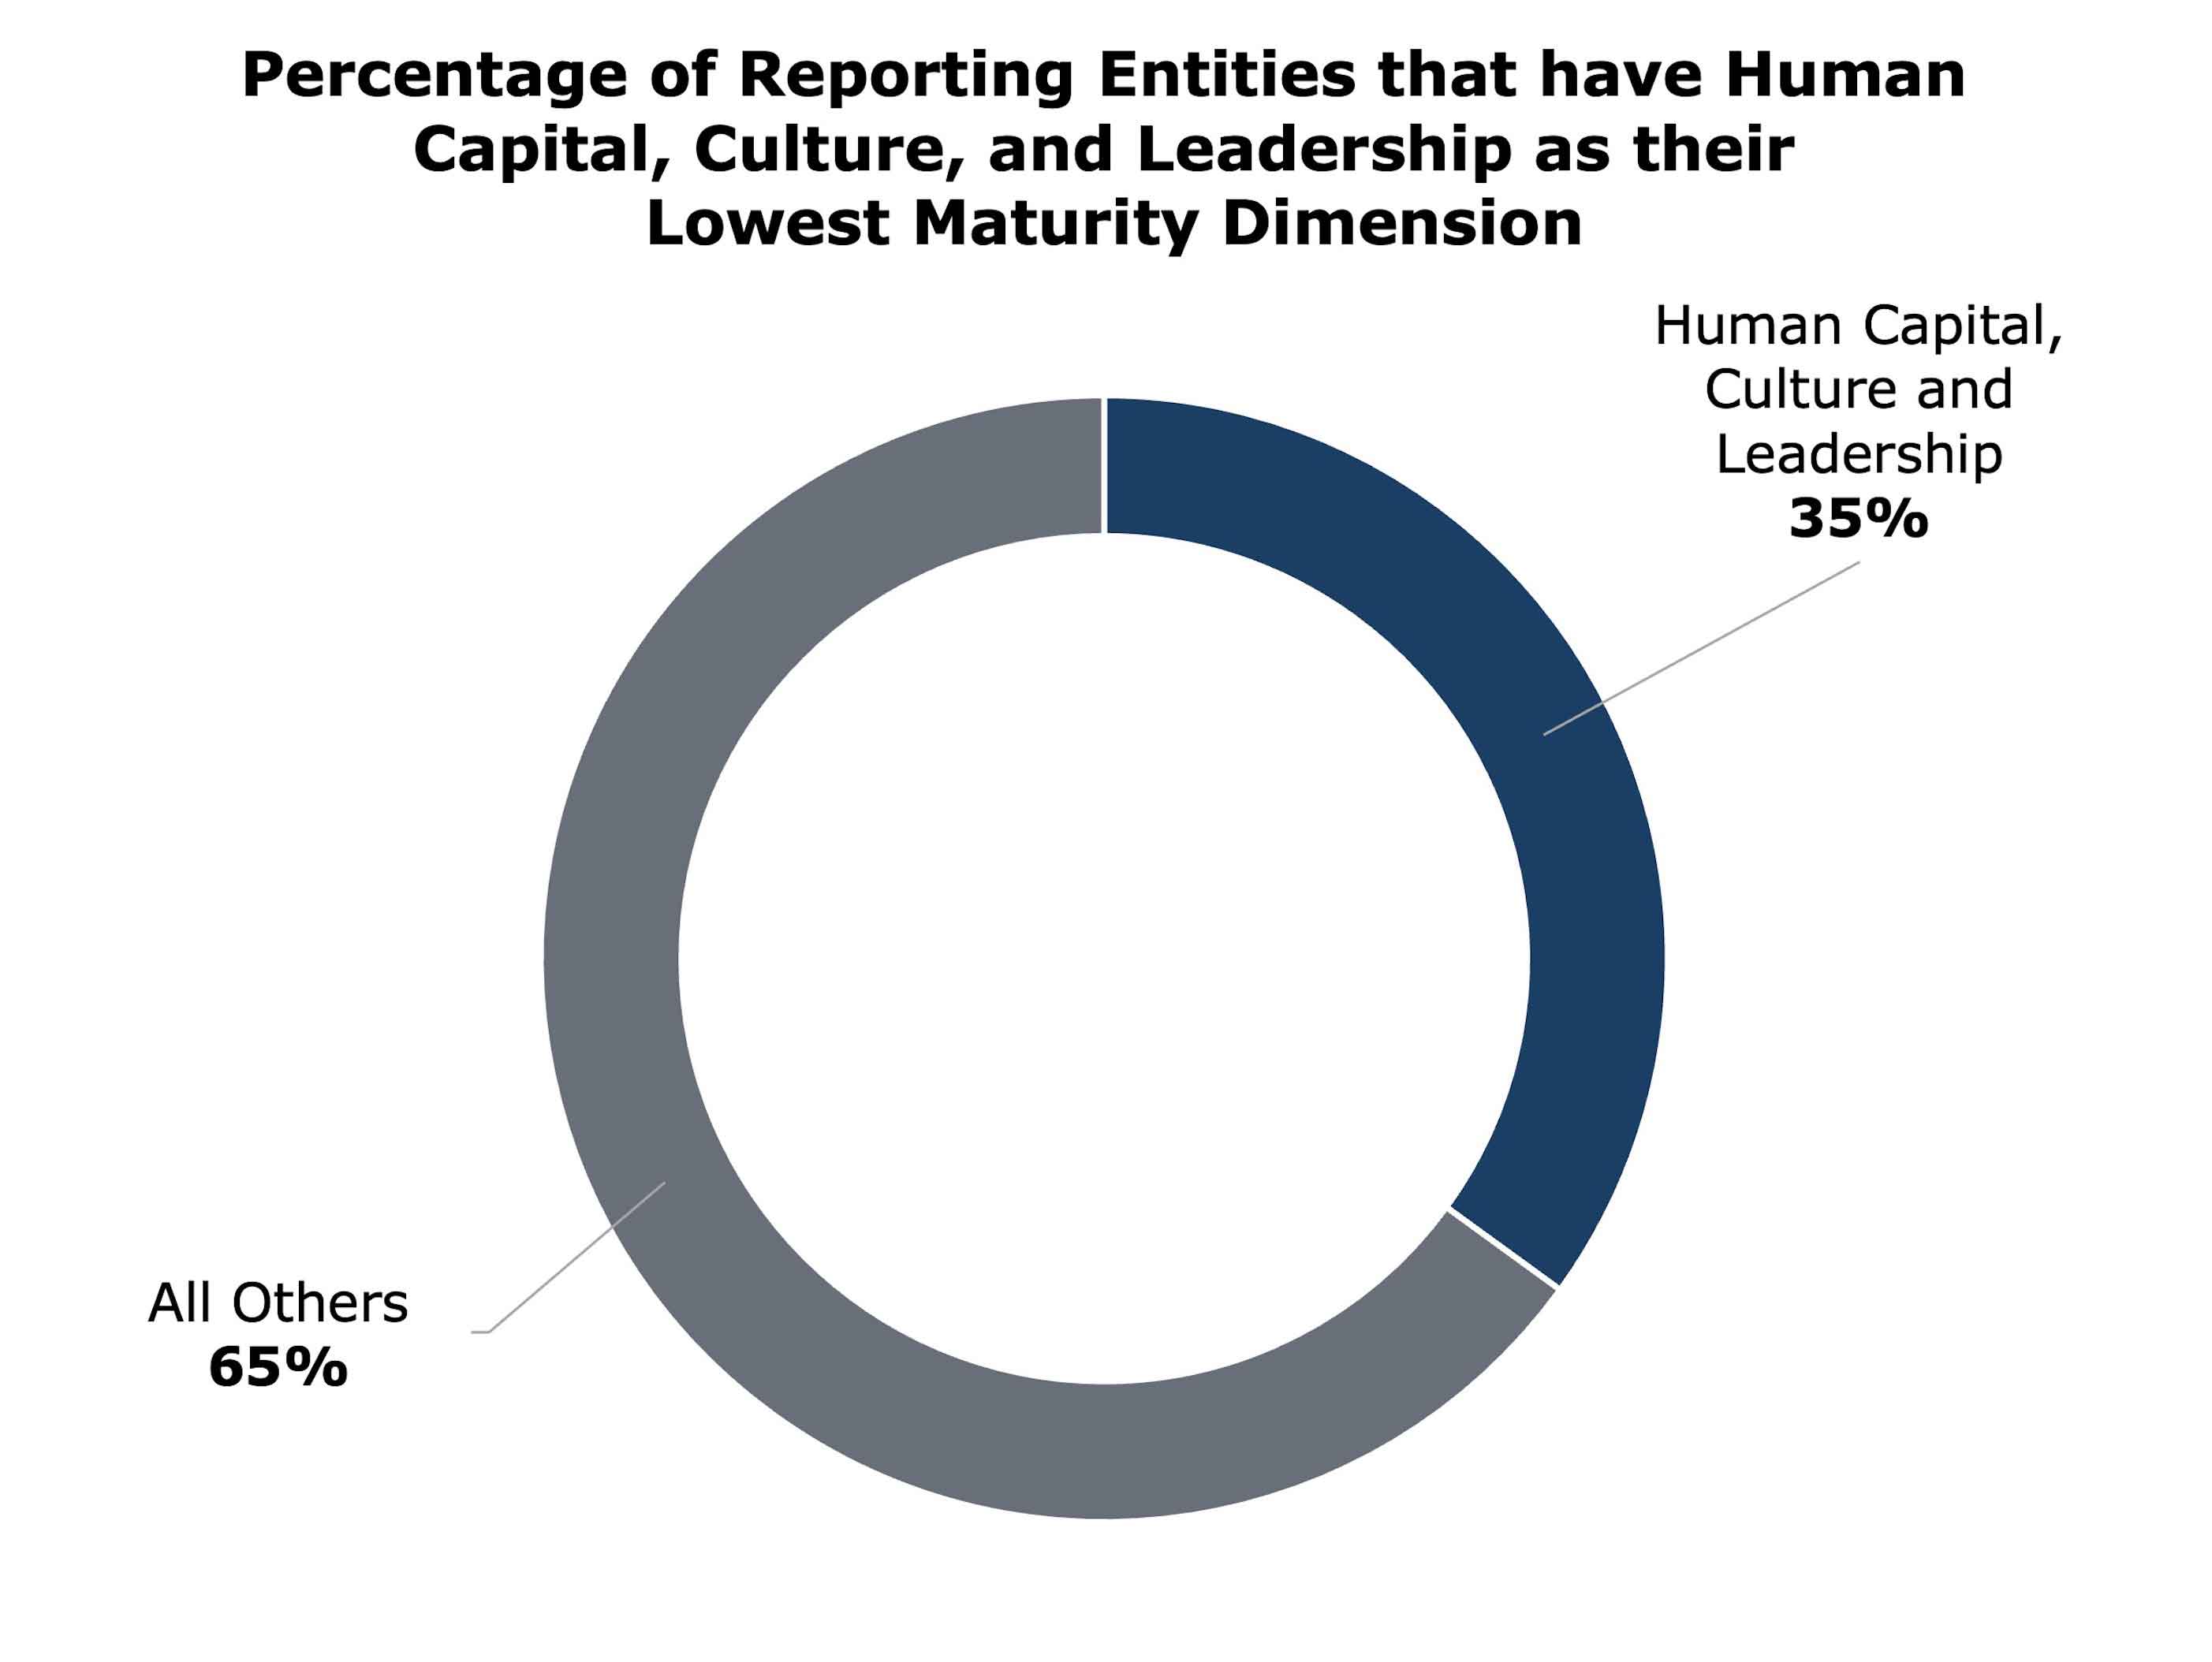
- As depicted, 103 of the 249 reporting entities, or 41%, of reporting entities had Training as their lowest (or tied for lowest) maturity dimension, while 86 of 249 reporting entities, or about 35%, had Human Capital, Culture, and Leadership activities as their lowest maturity dimension.
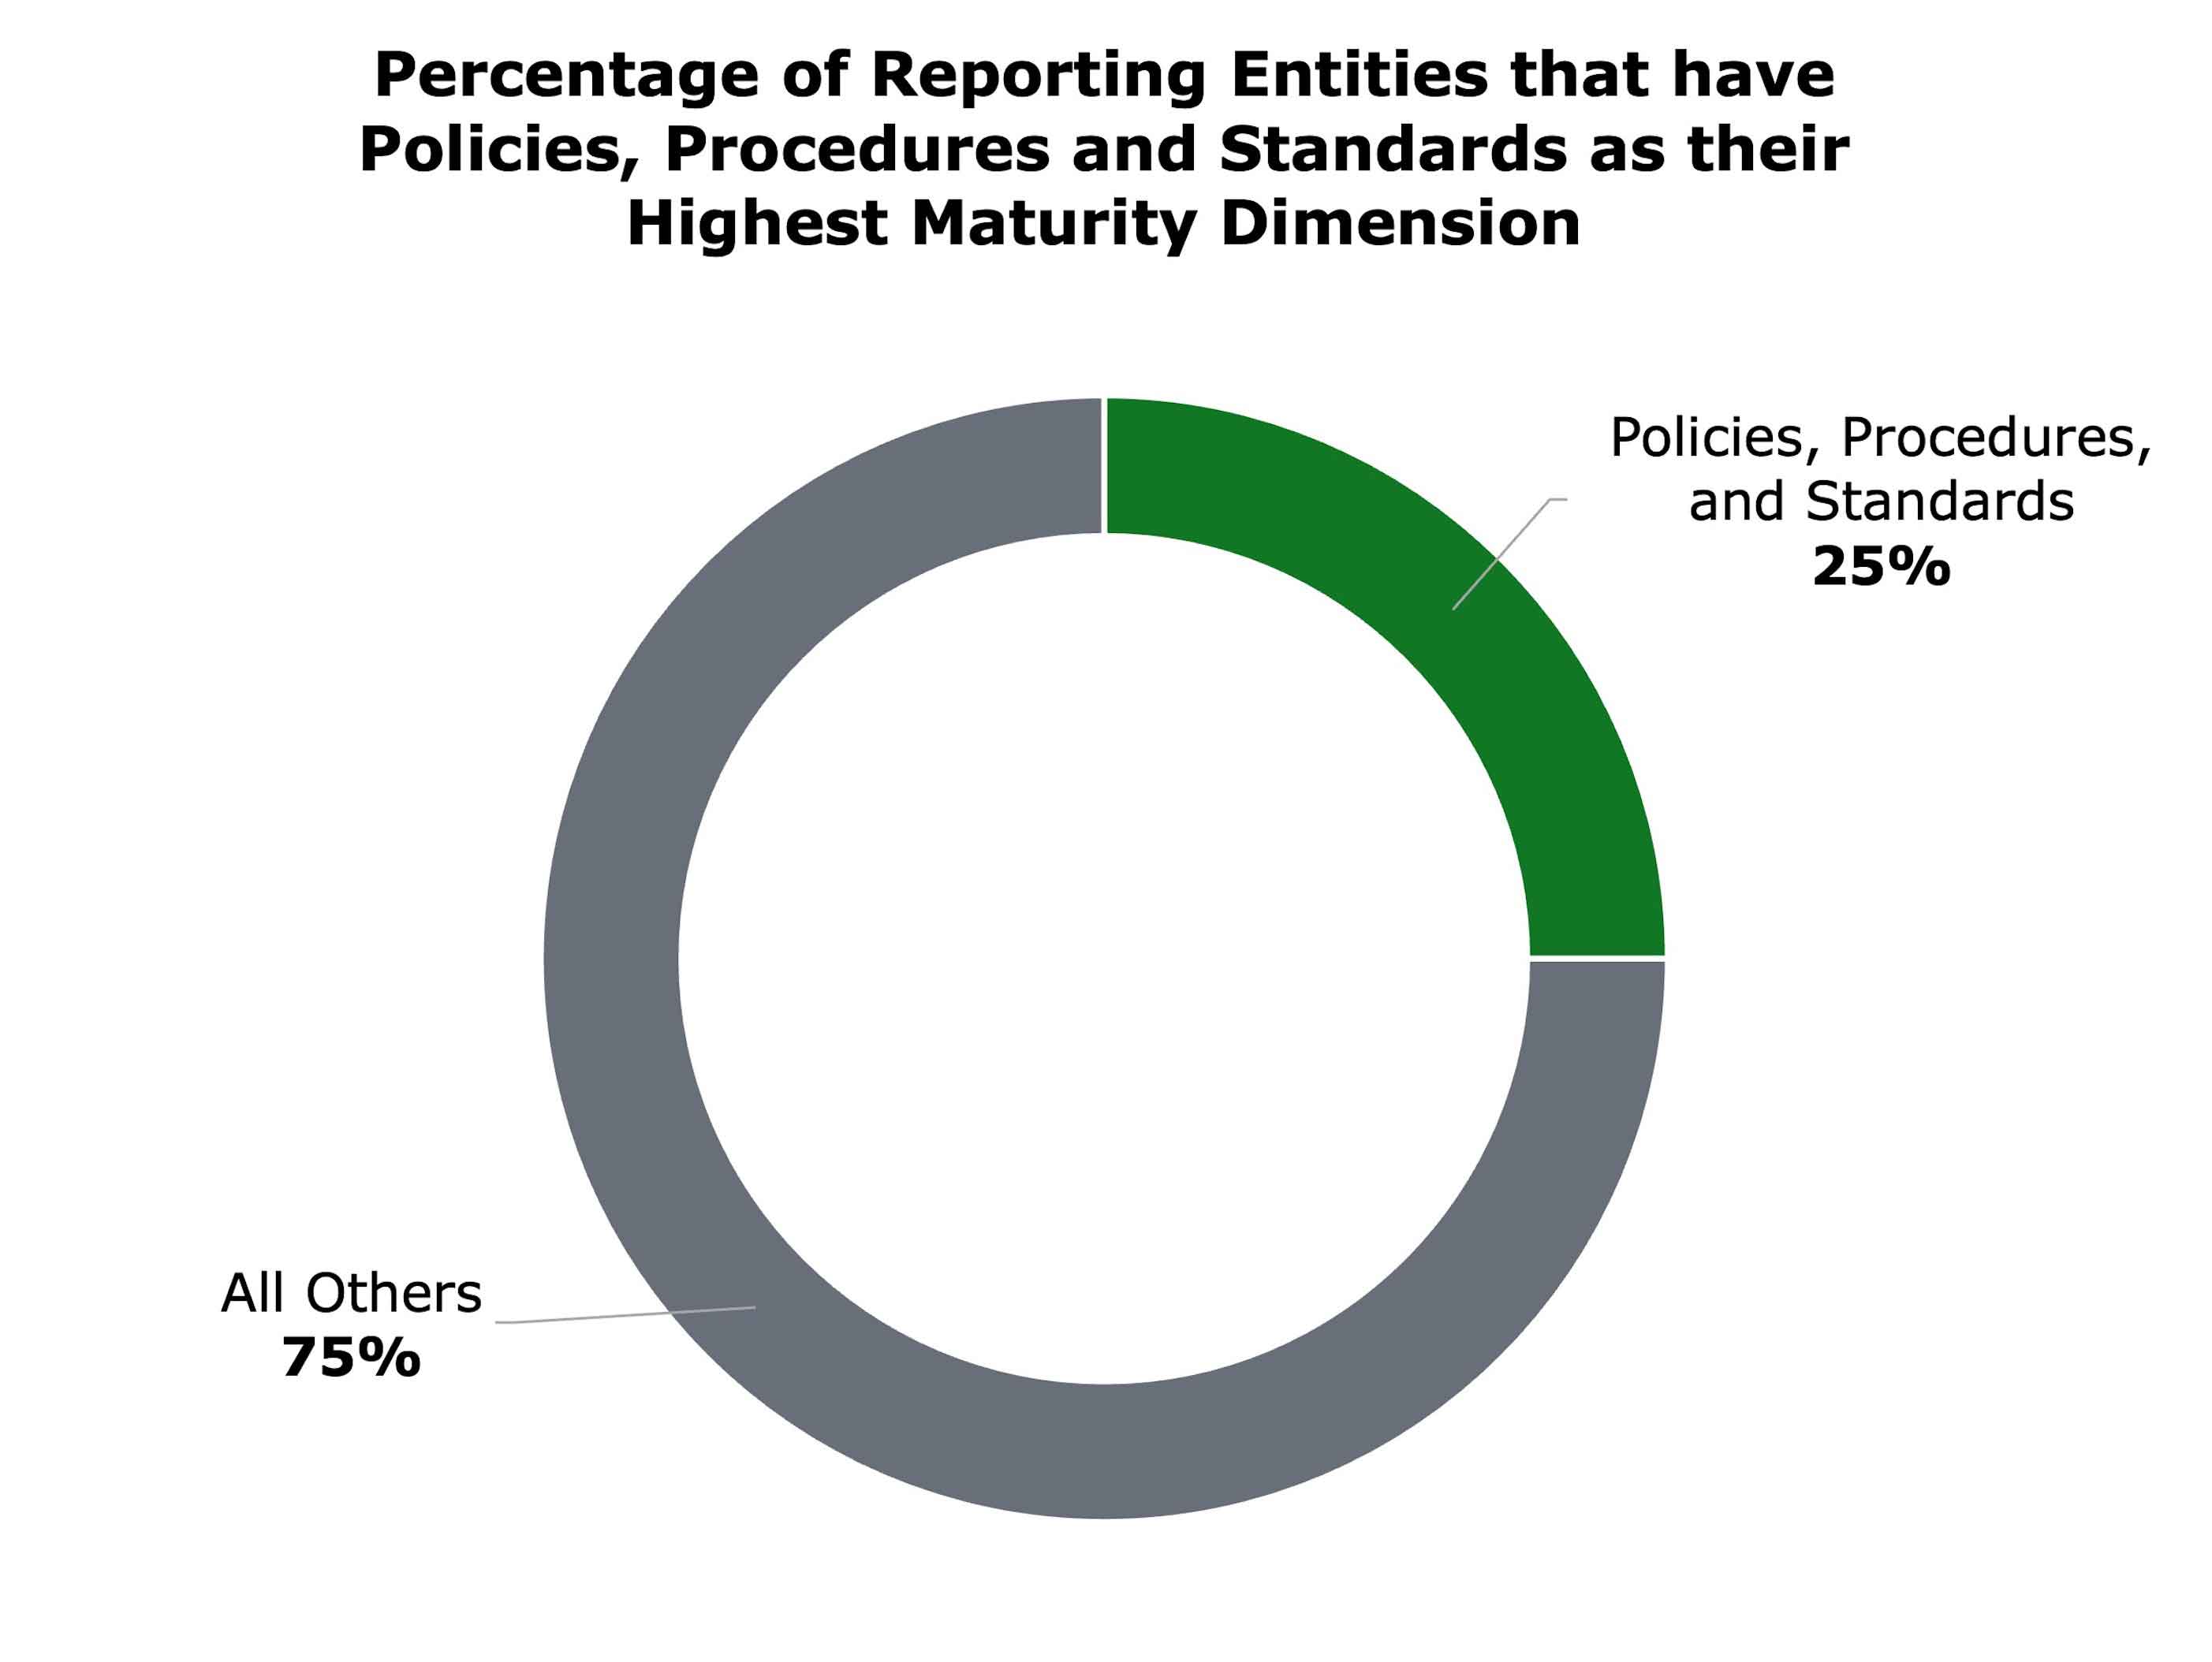
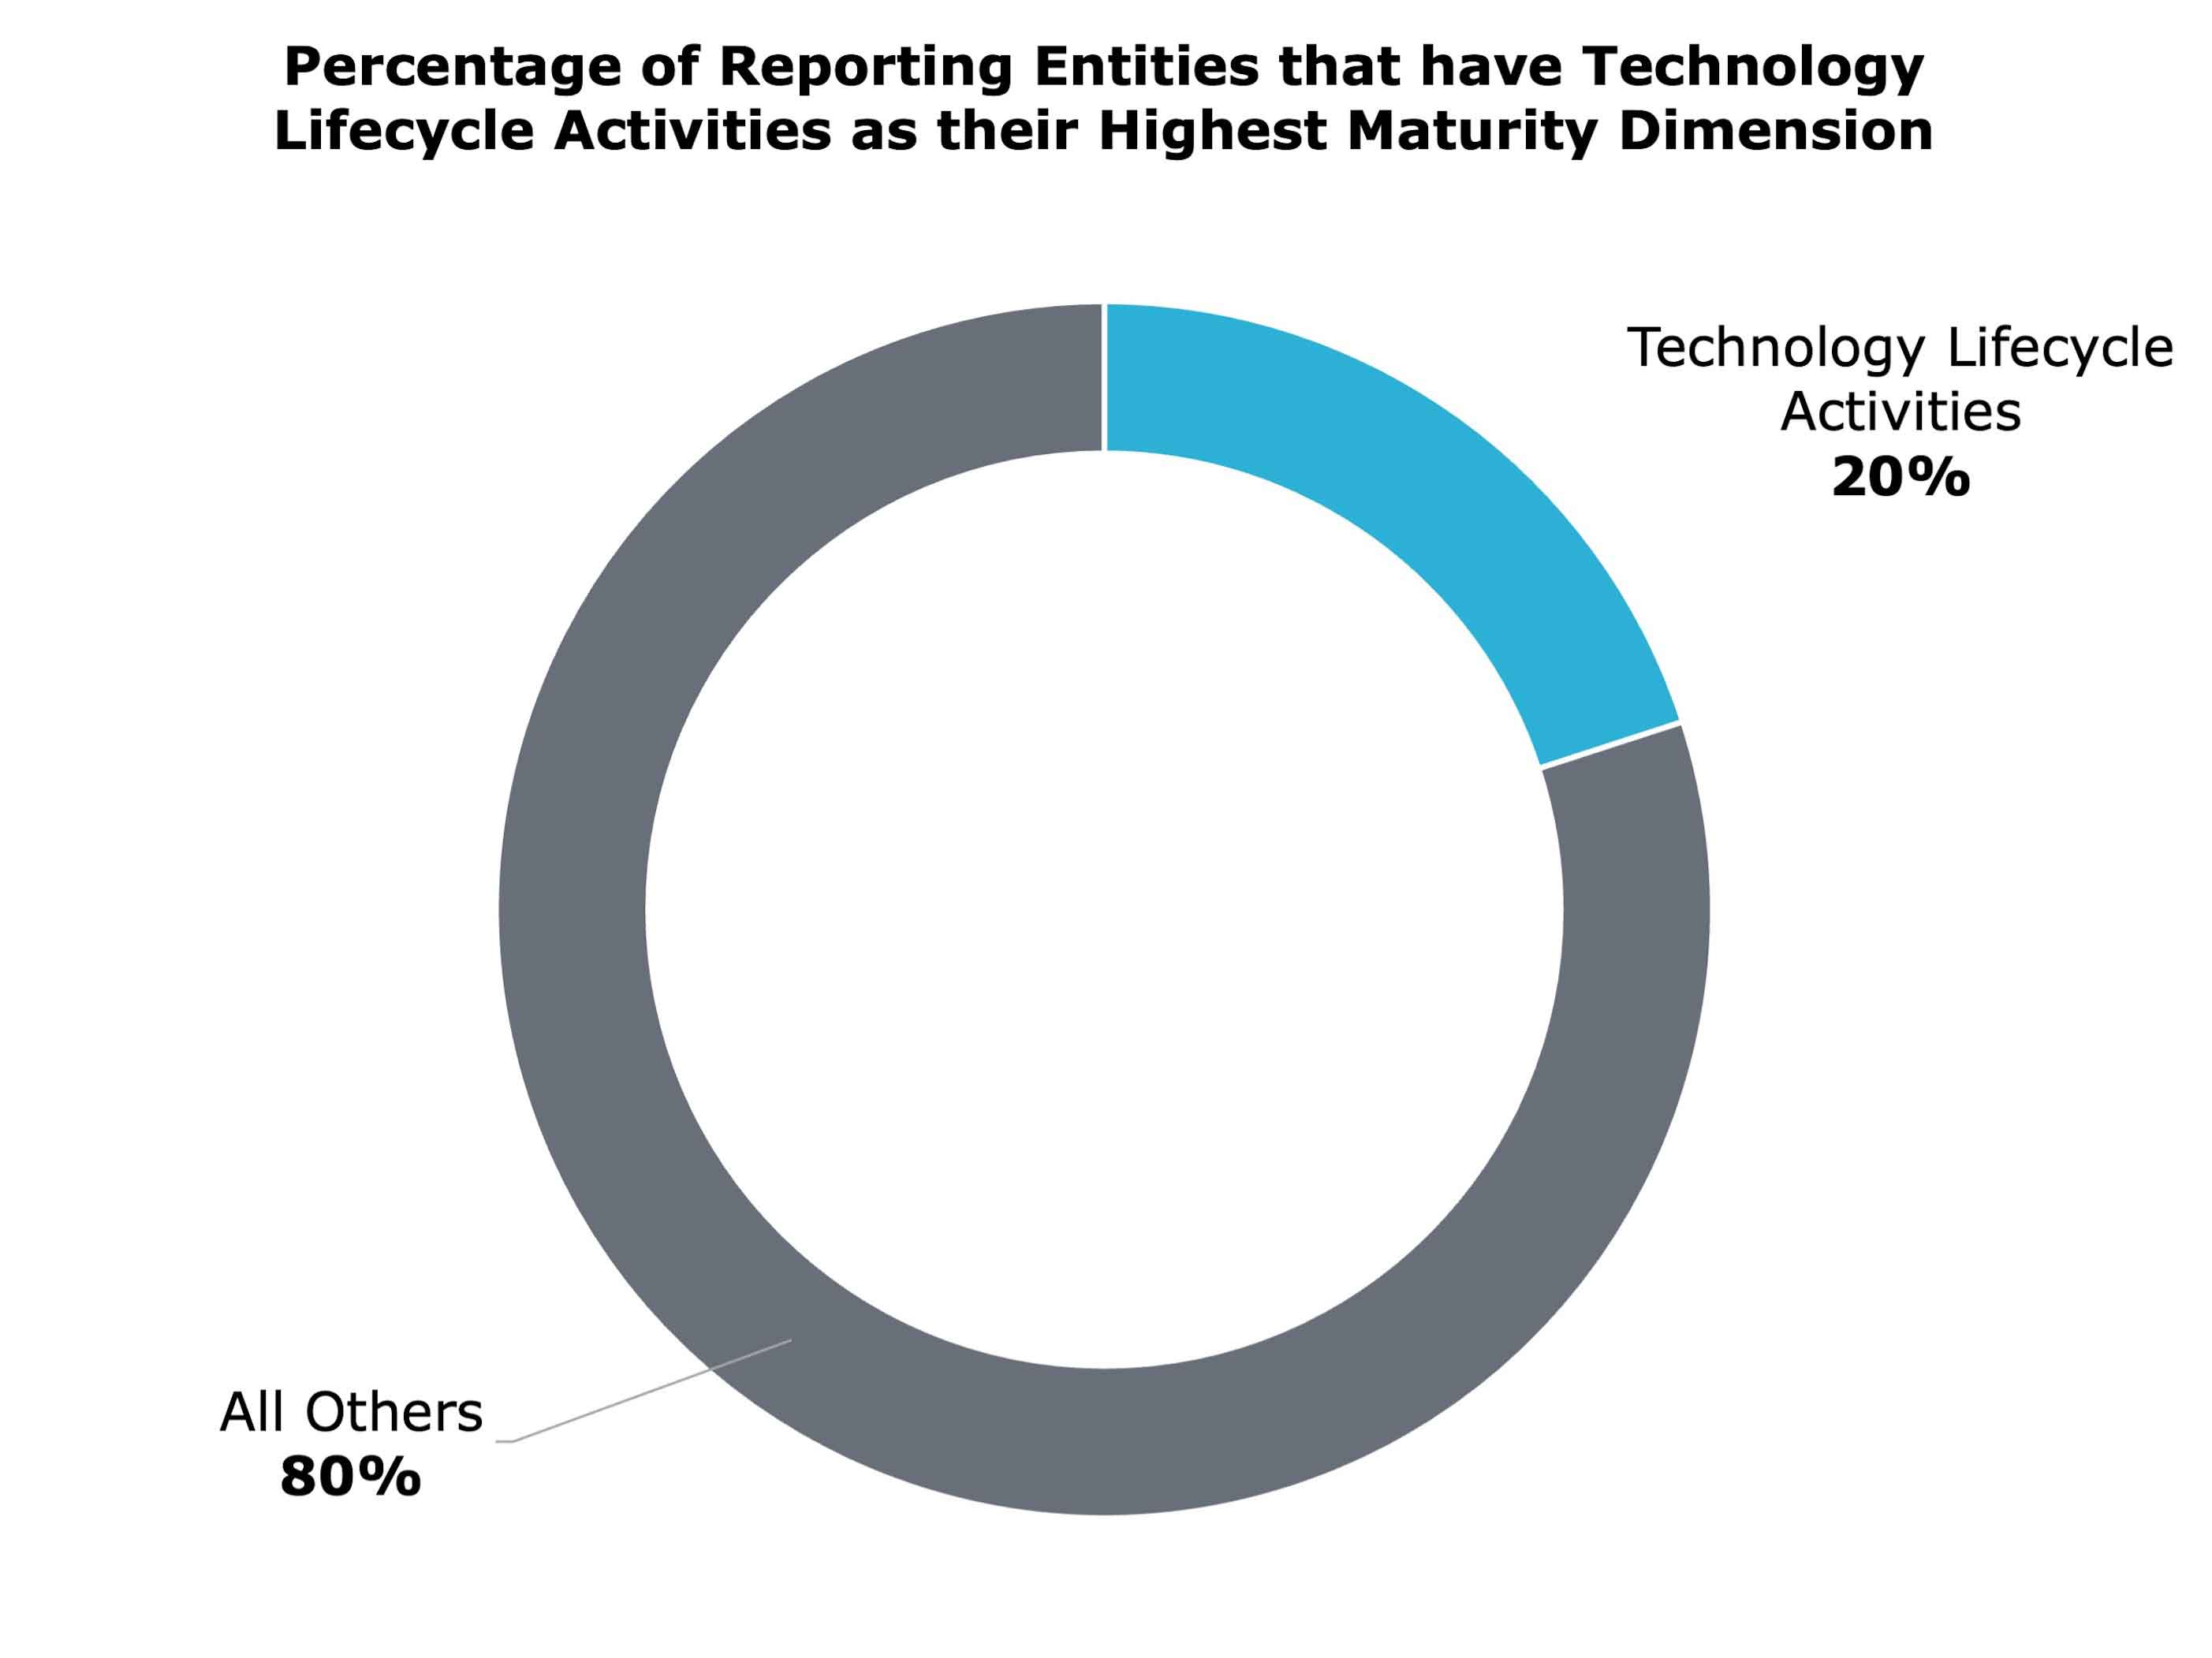
- Of all respondents, 63 of 249, or about 25%, had Policies, Procedures, and Standards as their highest (or tied for their highest) dimension, while 51 of 249, or 20%, of reporting entities had Technology Lifecycle Activities as the highest maturity dimension.
- The average of dimensional high scores – regardless of which dimension – across all respondents was 3.67 out of 5.
- The average dimensional low scores – regardless of which dimension – across all dimensions was 0.88 out of 5.
- Reporting entity dimensional scores ranged from zero to five, meaning there were reporting entities that reported the top rating for every criteria within a dimension but also reporting entities that displayed the lowest maturity across all criteria within a certain dimension.
- Significant variance was also found for multiple reporting entities that had both a 5 for at least one dimension and a 0 for others; there were 10 such reporting entities.
Conclusion
Although there is some range between the maturity dimensions (1.57 to 2.57), overall the maturity levels were low governmentwide (with an overall average of 2.17). This is evidenced by the top maturity dimension (Technology Lifecycle Activities) barely halfway up the 5-point scale. While some reporting entities are very mature in some areas, on the whole, every maturity dimension can be significantly improved. Furthermore, there were over 60 reporting entities that had dimensions with the lowest possible maturity score. This demonstrates that even minor improvements or assistance could make a significant positive impact for many reporting entities.
On average, even the highest and second highest maturity dimensions (Technology Lifecycle Activities and Policies, Procedures, and Standards) fall in the Moderate bracket, with both averages between two and three. Furthermore, the lowest and second lowest maturity dimensions (Training and Human Capital, Culture, and Leadership) avoid the Very Low bracket, with both averages between one and two. Thus, these findings show a narrow spread of averages related to maturity, all with a relatively low ceiling and a relatively high floor.
Footnotes
- Or tied for lowest. This and the next three graphs are presented separately as there is some overlap where the dimensional scores were equivalent, creating duplicates of lowest and highest maturity dimensions, which if combined together would be misleading. ↩